Using the E3SM CDash Dashboard
- James Foucar
- Wade Burgess
- Noel Keen
- Robert Jacob
General Information
Our dashboard is here:https://my.cdash.org/index.php?project=E3SM
Each full run of our tests is called a "Build" and produces a row in the dashboard. The columns are as follows:
- The "Site" column is the machine where the tests ran
- The "Build Name" column is the name of the build and should be in the format <e3sm_test_suite_name>_<branch>_<compiler>, e.g. e3sm_developer_master_gnu
- The Update column can be ignored for us at this time
- The Configure "Warn" column is used to show namelist diffs
- The Build "Error" column is used to list tests that crashed before making it to their RUN phase.
- The "Test" column is where things get interesting for us, it is split into three sub-columns:
- Not Run - Tests that never ran, or were interrupted, due to timeout
- Fail - This is the worst result for a test. Could mean: failed to build, failed during run, or a non-BFB change in results
- Pass - The test is in good shape
- Any column that displays a number can also display smaller numbers that represent the change from the previous run. +2 means two more tests fell into this column that previously did. -2 means two fewer did.
- The "Build Time" column is the time when the test finished.
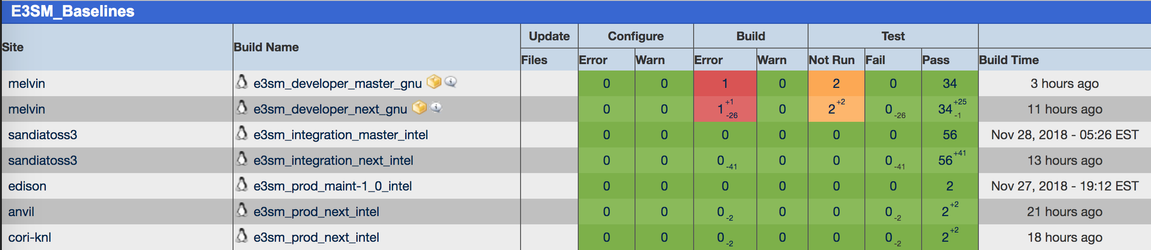
Our tests are split into the E3SM_Baselines, E3SM_Machine_Coverage, and E3SM_Custom_Tests groups. We primarily monitor the E3SM_Baselines group; all the tests in this group do baseline comparisons; the results in this group determine if PRs can be merged. E3SM_Machine_Coverage is used to make sure E3SM continues to be able to run on all our supported platforms; we do NOT do any baseline operations for these tests. E3SM_Custom_Tests is a catch-all for any additional testing that people want to do. All our groups will continue to show the most recent test results for a test on the front page dashboard until new results for that test arrive. The upside is that we have a number of tests, like e3sm_integration on edison, that take several days to complete. Therefore, there should always be results for edison on the dashboard, even if they are a couple of days old. The downside is that users may see results on the front page and assume that they are up to date. Please pay special attention to the "Build Time" column on the far right to see how recent a result is.
There are many clickable items in the dashboard, the most useful is usually to click the number under the "Test" column of the tests you want to see (usually failing tests are the most interesting to probe, so you'd click the number in the "Fail" sub-column). This will take you to a page with some data about the test run at the top and a list of tests that had a specific result. The most useful data at the top of the page is presented in the Out-of-the-Box (OOTB) field named "OS Version." Jim Foucar configured this field to display the sha1 of the commit that was tested (it is not possible to rename the field though). Below the general information is a list of tests, and again, there are many clickable items. The most useful clickable item for a test is it's Status field. Clicking this will take you to the TestStatus.out data for the test, which should help to give you some clue as to what happened.
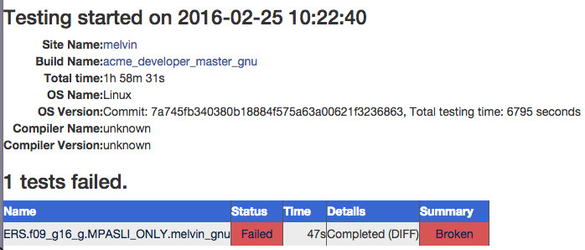
If "0s" is in the "Time" column, that usually signifies a build failure, as opposed to a failed test.
- Test Diagnosis Walkthrough
- Accessing Log Data for Failed Tests
- Manually uploading test results to cdash