CAM-FV Grid Overview
- Robert Jacob
- Mark Taylor
- Charlie Zender
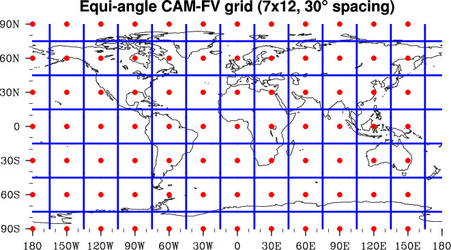
Lat-Lon "Cap" Grids
The first plot below shows the grid used by CAM-FV for all scalar fields. NCL refers to this as a "fixed" gridThe red dots show where the data are located, and the blue lines give the cells associated with each data point. Data is interpreted as cell averages at the red dots. Because of the lat/lon representation, data at the poles are actually duplicated for every longitude. A grid with equal spacing in both latitude and longitude will have dimensions (N+1) x 2N. Data at 180E = 180W are not duplicated in the file, and to convey this, we only plot red dots at 180W and not 180E.
This SCRIP file for this grid can be created via NCO's ncremap:
ncremap -G ttl="lat-lon-cap-grid"#latlon=7,12#lat_typ=fv#lon_typ=grn_ctr -g 7x12_SCRIP.nc
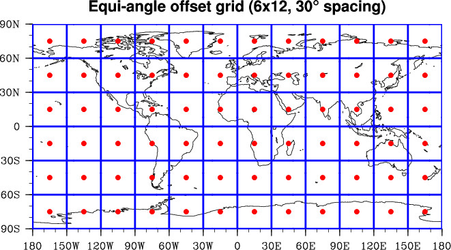
Lat-Lon "Offset" Grids
The next plot shows what NCL refers to as the fixed offset grid (aka Uniform). This grid is commonly used for global observational datasets and interpolated model data in the CMIP archive. This is the internal CAM-FV velocity grid. CAM-FV can output these velocities if you ask for 'US' or 'VS' in the history. The 'U' and 'V' data in CAM-FV history has been interpolated to the fixed grid shown above. Gaussian grids (used by CAM-EUL) look nearly identical to these offset grids, except Gaussian grids use a spacing in latitude which is not quite equi-angular. A grid with the same equal spacing in both latitude and longitude will have dimensions N x 2N.
This SCRIP file for this grid can be created via NCO's ncremap:
ncremap -G ttl="lat-lon-uniform-grid"#latlon=6,12#lat_typ=uni#lon_typ=grn_ctr -g 6x12_SCRIP.nc