How to run the PCMDI Metrics Package (PMP)
- Chris Golaz
- Qi Tang
The page illustrates how to run the PCMDI metrics package (PMP) on ACME model output. Please be aware that PMP is still experimental and under development. Currently, PMP is only supported on crunchy.llnl.gov.
Prerequisites
- Account on crunchy.llnl.gov
- Climatology files generated by ncclimo (Generate, Regrid, and Split Climatologies (climo files) with ncclimo). Sample files are available on crunchy for the step-by-step guide below.
Step-by-step guide
Get ACME PMP utility scripts included in ACME PreAndPostProcessingScripts repository
For illustration, we clone the repository under ~/ACME_code (Note: need to add the SSH key to GitHub account before cloning)
mkdir -p ~/ACME_code
|
|---|
Set-up working directory and environment
Create working directory and copy utility scripts
|
|---|
Load conda environment
|
|---|
Pre-process climatology files
Note: PMP uses the time variables in the climatology files to determine which months they are for, assuming the file with smallest time is January and so on. This causes problem when the climatology files are created using ncclimo with -a scd option. Since scd means seasonally continuous December (The first month used will be Dec of the year before the start year), the December climatology file will have the smallest time variable. cdscan command in the next step will misplace the input for one month (e.g., the December file for January, etc.).
check_climo.py will check the time variables in the January and December climatology files. If the December file has a smaller time value, it will be added by 365.
| python check_climo.py $input_path |
|---|
Use cdscan to create xml describing input files
Note: Input files are monthly climatology. Don't put seasonal and annual climo files in the input directory.
|
|---|
The output file be a file named xmls/alpha6_1850_0070-0099.xml that describes the input netcdf files.
Process climatologies to be consistent with CMIP data structure
|
|---|
The result will be a number of individual netcdf files in the sub-directory data/alpha6_1850_0070-0099:
ls data/alpha6_1850_0070-0099/
pr.nc prw.nc psl.nc rlutcs.nc rlut.nc rsutcs.nc rsut.nc ta.nc tas.nc tauu.nc tauv.nc ua.nc va.nc zg.nc
Compute derived fields (currently only CRE fields)
|
|---|
Two additional netcdf files for LW and SW cloud radiative effects will be created under data/alpha6_1850_0070-0099:
ls data/alpha6_1850_0070-0099/pr.nc prw.nc psl.nc rltcre.nc rlutcs.nc rlut.nc rstcre.nc rsutcs.nc rsut.nc ta.nc tas.nc tauu.nc tauv.nc ua.nc va.nc zg.nc
Run PMP mean climate statistics
|
|---|
This is the core of PMP. It will compute climate statistics comparing the model output with various observational datasets. The statistics are stored in json files located under the subdirectory results/pmp:
ls results/pmp/*.json
results/pmp/pr_2.5x2.5_esmf_linear_metrics.json results/pmp/ta-850_2.5x2.5_esmf_linear_metrics.json
results/pmp/prw_2.5x2.5_esmf_linear_metrics.json results/pmp/tas_2.5x2.5_esmf_linear_metrics.json
results/pmp/psl_2.5x2.5_esmf_linear_metrics.json results/pmp/ua-200_2.5x2.5_esmf_linear_metrics.json
results/pmp/rltcre_2.5x2.5_esmf_linear_metrics.json results/pmp/ua-850_2.5x2.5_esmf_linear_metrics.json
results/pmp/rlut_2.5x2.5_esmf_linear_metrics.json results/pmp/va-200_2.5x2.5_esmf_linear_metrics.json
results/pmp/rstcre_2.5x2.5_esmf_linear_metrics.json results/pmp/va-850_2.5x2.5_esmf_linear_metrics.json
results/pmp/ta-200_2.5x2.5_esmf_linear_metrics.json results/pmp/zg-500_2.5x2.5_esmf_linear_metrics.json
There is one json file for every variable. Additionally, re-gridded netcdf files are under the subdirectory interpolated-output.
Create portrait plots
|
|---|
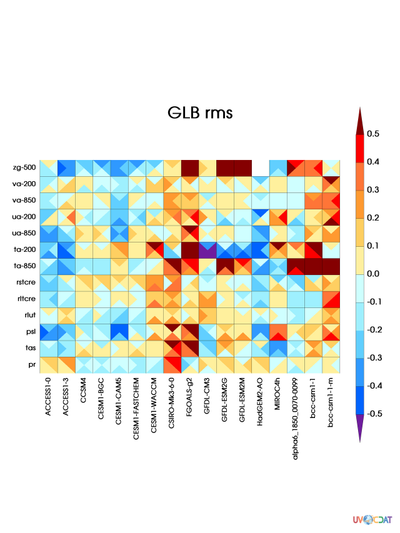
The resulting output should be a png image file under the subdirectory plots:
ls plots
acme_pmp-control_tests_rms_GLB.png
This image should look like
To generate portrait plots for other regions (tropics, nothern extra-tropics, souther extra-tropics), edit portrait_plots.py and change definition of the region from global to another option and then rerun the script.
reg = 'GLB' #reg = 'NHEX' #reg = 'SHEX' #reg = 'TROPICS' |
|---|
Questions?
Chris Golaz may be able to help.
Acknowledgements
Many thanks to Peter Gleckler and Charles Doutriaux (Unlicensed) for their help getting me started with PMP.