Debugging on a workstation with ddd
- Iulian Grindeanu
ddd is a frontend for gdb, and it is sometimes easier to use, in a parallel setting, than gdb; It accepts gdb commands, and it is sometimes more intuitive
I have a small case, fully coupled, that can be run on 4 tasks on a workstation;
1) create, setup, build and submit a small fully coupled case, on mcs network at ANL;
/homes/iulian/ACME_2/cime/scripts/create_newcase --res ne11_oQU240 --compset A_WCYCL1850 --case /homes/iulian/CASES/COU4 --mach anlworkstation
(anlworkstation is usually compute001, but any ubuntu 14.04 machine on the network would do fine, as compute001 is very busy)
./xmlchange --id STOP_N --val 1
./xmlchange --id DEBUG --val TRUE
./xmlchange --id ROOTPE_CPL --val 2
./xmlchange --id NTASKS --val 4
./xmlchange --id NTASKS_ATM --val 2
./xmlchange --id NTASKS_CPL --val 2
./xmlchange --id NTASKS_ESP --val 1
./xmlchange --id NTASKS_OCN --val 2
ocean will be run on 2 tasks, cice on 4 tasks, and we need to make sure the graph files are partitioned in 2 and 4 (see Make a new graph partition for MPAS for help)
For myself, I made some files here:
/homes/iulian/ocn_met/


~/ocn_met > ls
mpas-cice.graph.info.151209 mpas-o.graph.info.151209 mpas-o.graph.info.151209.part.8
mpas-cice.graph.info.151209.part.4 mpas-o.graph.info.151209.part.2
mpas-cice.graph.info.151209.part.8 mpas-o.graph.info.151209.part.4
then I have to modify user_nl_mpaso and user_nl_mpascice, for the location of this partition file
config_block_decomp_file_prefix = '/homes/iulian/ocn_met/mpas-cice.graph.info. 151209.part.'
Make sure that case setup, build, submit work;
2) add the soft keys necessary for a desktop run, on mcs:
more ~/ubu14.soft

+gcc-6.2.0
+szip-2.1-gcc-6.2.0
+mpich-3.2-gcc-6.2.0
+hdf5-1.8.16-gcc-6.2.0-mpich-3.2-parallel
+netcdf-4.3.3.1c-4.2cxx-4.4.2f-parallel-gcc6.2.0-mpich3.2
+pnetcdf-1.6.1-gcc-6.2.0-mpich-3.2
+cmake-3.5.1
@default
make sure you can launch the job from run folder, with the acme executable:
./preview_run
BATCH SUBMIT:
 case.run -> None

MPIRUN: mpirun -np 4 /homes/iulian/acme/scratch/COU4/bld/acme.exe >> acme.log.$LID 2>&1
So something like this should work:
cd /homes/iulian/acme/scratch/COU4/run
mpiexec -np 4 ../bld.acme.exe
3) prepare a command file for ddd, which accepts standard gdb commands; you can put break points at specific locations;
My file command file (named ddd.acme) looks like this, for example ( lines that start with # are comments, ignored by ddd)
more ddd.acme


# call cesm_pre_init1()
break cesm_driver.F90:37
# call cesm_pre_init2()
break cesm_driver.F90:54
#call seq_comm_init()
break cesm_comp_mod.F90:614
run
In the run folder, run ddd in parallel, with a command like this:
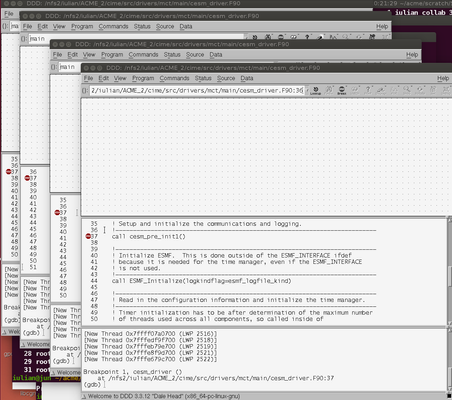
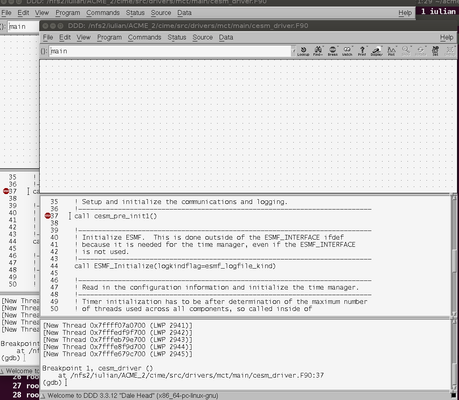
mpiexec -np 4 ddd ../bld/acme.exe -x ddd.acme
This will open 4 ddd windows, in which you can step using regular gdb commands, or F keys ( F6 for next, F5 for step in, etc).
Each of the processes will need to be managed separately (concurrently). Which could be cumbersome
Being parallel, there could be many barriers, so you need to be careful and patient when stepping through
An alternative (for less numbers of windows to manage) is to use ":" syntax; launch only 2 processes in debug mode, and the rest regular launch; of course, the processes will have to wait for each other
mpiexec -np 2 ddd ../bld/acme.exe -x ddd.acme : -np 2 ../bld/acme.exe
This will launch the first 2 processes (tasks 0 and 1) in debug mode, the last 2 (tasks 2 and 3) in background
You can be even more specific, launch 0 and 2 in debug mode, 1 and 3 in background; also, you can use different ddd.acme command files per process (different tasks can stop at different locations; you can unleash the parallel guru in you ![]() !!)
!!)
mpiexec -np 1 ddd ../bld/acme.exe -x ddd.acme0 : -np 1 ../bld/acme.exe : -np 1 ddd ../bld/acme.exe -x ddd.acme2 : -np 1 ../bld/acme.exe
Each ddd window that opens has to be managed separately; Also, viewing fortran arrays is not very convenient in gdb/ddd ; it depends if they are allocated or on stack;
also, the structures are relatively hard to view (compared to a commercial debugger like ddt)
For example, to see some values in the array clat_p, in the components/cam/src/physics/cam/phys_grid.F90, at line 554, I had to do this:
first, tried
(gdb) print clat_p

$5 = (0)
then:
(gdb) print clat_p(1)

$6 = 9.7500487655327952e-316
Clearly garbage ![]()
then:
(gdb) print (double*)clat_p

$7 = (PTR TO -> ( double )) 0xbc337d0
getting hopeful! ![]()
and finally:
(gdb) print *((double*)clat_p)

$10 = -1.5707963267948966

(gdb) print *((double*)clat_p)@20

$11 = (-1.5707963267948966, -1.4622569700835437, -1.41789565151449, -1.2866366018075255, -1.268613997168571, -1.1790993072283245, -1.1780972450961724, -1.1661280303051875, -1.1017017998908656, -1.0695578883848194, -1.061342265069581, -1.04089353704597, -1.015155767685626, -0.96894203515823485, -0.9115711987399715, -0.89393752010880134, -0.88948374448969525, -0.86345569259639399, -0.86345569259639376, -0.83579524309410913)

(gdb)
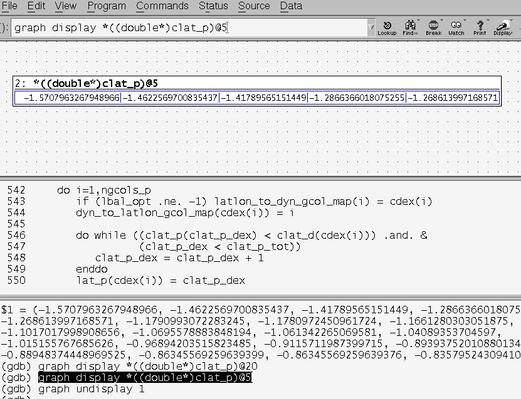
The main advantage of ddd over gdb is that it can display variables in a window
(gdb) graph display *((double*)clat_p)@5