A1 Ozone Hole: Validation Phase 1
This page should describe Validation Tests performed for this stand alone feature and should provide links to all the result pages.
Summary
The Linoz_MAM3 capability was run for 1850 and 2000 using the cameronsmith1/atm/Ozone-hole-Linoz-v2 branch at ne30 resolution. (Note: the v2 in the branch name refers to the version of Linoz, and NOT to the version of ACME.)
The ozone simulated by ACME with Linoz is validated by comparing the simulated ozone field against historical observations:
- atmospheric ozone columns,
- zonal-mean ozone distribution,
- Area of Antarctic ozone hole,
- Degree of ozone depletion.
The criteria for matching is if the difference compared with observations is comparable (or better) than the published ACCMIP simulations with the LLNL-superfast mechanism.
The validation passes the criteria.
Validation Test 1: Atmospheric Ozone Columns
Date last modified:
Contributors: Philip Cameron-Smith (Unlicensed)
Provenance: cameronsmith1/atm/Ozone-hole-Linoz-v2 branch at ne30 resolution
OMI Ozone column observations (circa 2000)
.gif?version=1&modificationDate=1446262410217&cacheVersion=1&api=v2&width=446&height=250)
ACME Linoz_MAM3 ozone columns (2000)
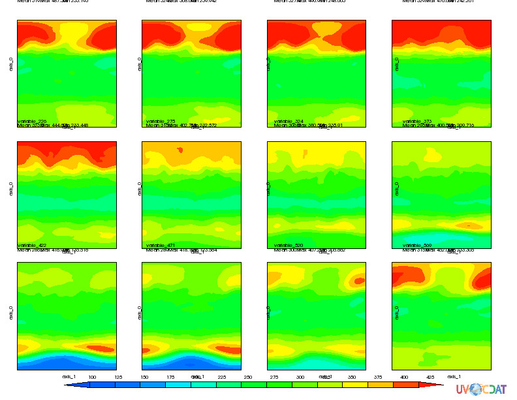
These are maps that correspond to the OMI maps above. The units are Dobson Units.
The missing contents and spurious labels are artifacts of UVCDAT.
The color scales for the models and observations are roughly comparable.
ACCMIP Ozone Columns by month (2000)
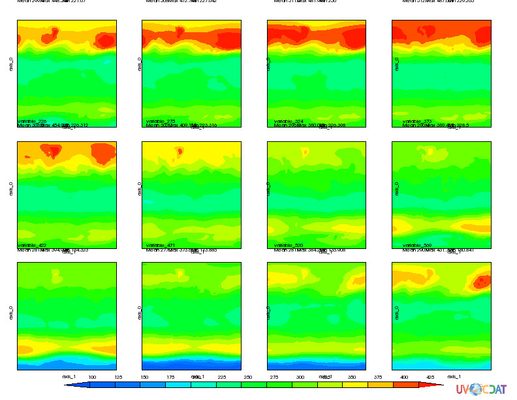
Both the older ACCMIP and current ACME simulations tend to get column ozone a little bit too thick. This is at least partly due to the poor resolution in the upper stratosphere in both models. A higher vertical resolution for ACME should improve the ozone simulations.
Validation Test 2: Zonal-Mean Ozone Distribution
Date last modified:
Contributors: Philip Cameron-Smith (Unlicensed)
Provenance: cameronsmith1/atm/Ozone-hole-Linoz-v2 branch at ne30 resolution
SBUV Satellite Observations of Zonal-Mean Monthly-Mean Ozone (1970-2014)
Note: The SBUV data (above) only goes down to 25 mbar, which corresponds to only the top three model layers (below).
The units on the SBUV plot are in ppm, unlike the model results below, but the colors are roughly comparable.
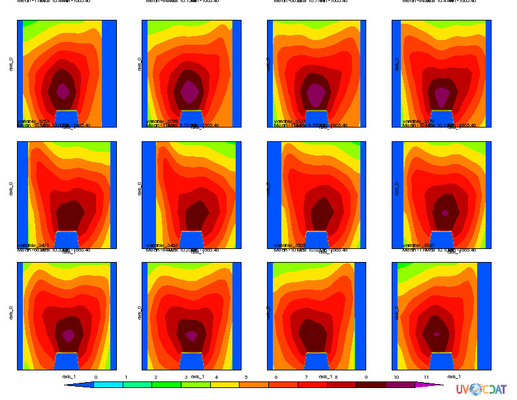
ACME Zonal-Mean Stratospheric Ozone (2000)
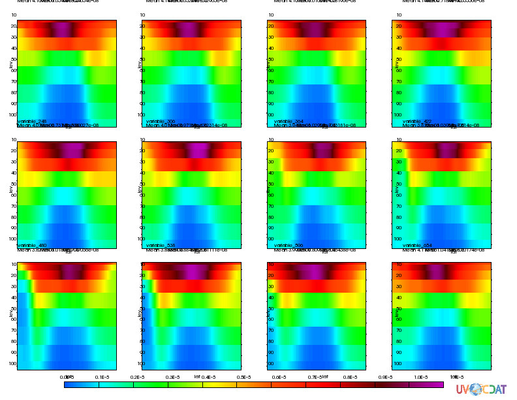
Note: The vertical axis is from 150 mbar to 3 mbar. The units are in mol/mol.
ACCMIP Zonal Mean Stratospheric Ozone (2000)
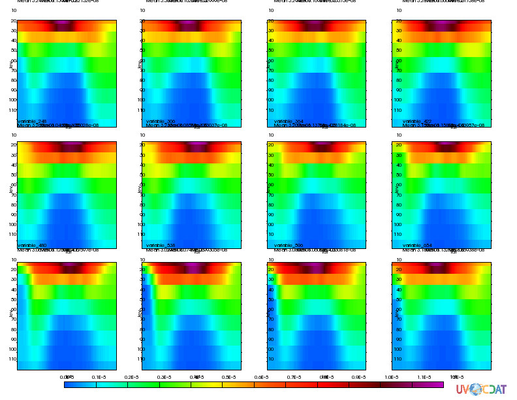
Note: The vertical axis is from 150 mbar to 3 mbar. The units are in mol/mol.
Validation Test 3: Extent of Antarctic Ozone Hole
Date last modified:
Contributors: Philip Cameron-Smith (Unlicensed)
Provenance: cameronsmith1/atm/Ozone-hole-Linoz-v2 branch at ne30 resolution
Comparison of the observation images in the NASA image to the model figures in validation test 1 & 2 above, show that the extent of the ozone holes in the model is about right.
Validation Test 4: Ozone Depletion Level
Date last modified:
Contributors: Philip Cameron-Smith (Unlicensed)
Provenance: cameronsmith1/atm/Ozone-hole-Linoz-v2 branch at ne30 resolution
CMDL Ozonesonde observations of Ozone Hole Column
NOTE: This is the most extreme ozone hole ever observed.
ACME Stratospheric Ozone Hole Columns
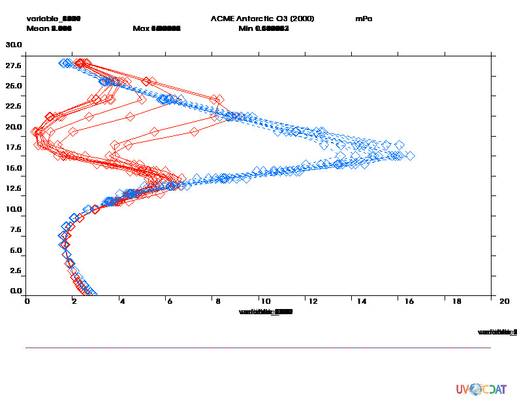
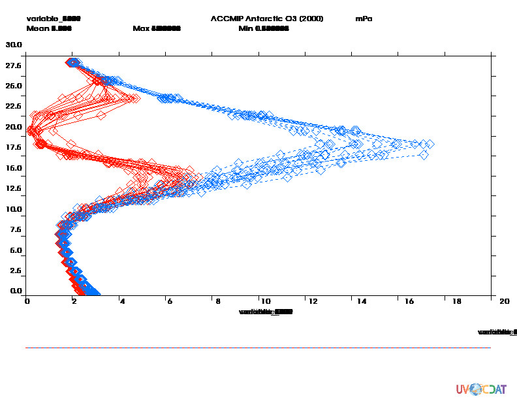
The red lines are different years of October Antarctic means. The Blue lines are the corresponding lines for July. These correspond well with the observed ozone profile above. Note the interannual variability, which is due to interannual variability in the dynamics. This is shown more clearly in the figures below, showing that both the observations and model generate occasional extremes.
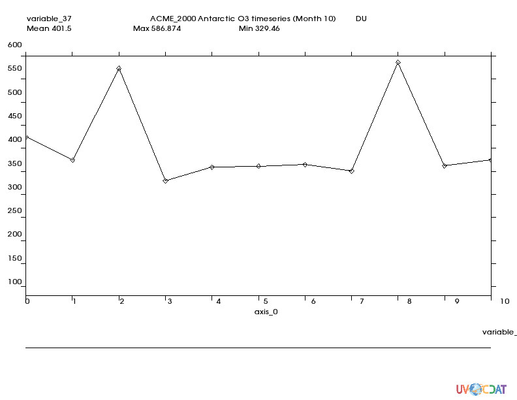
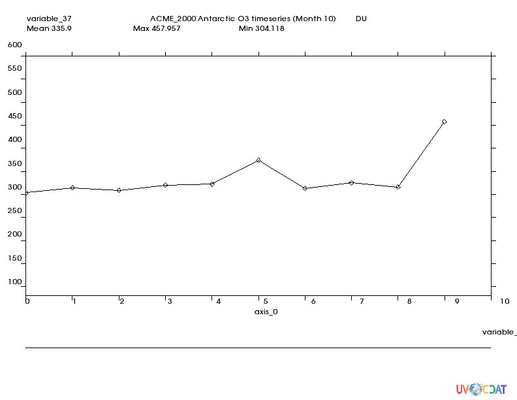
ACME Antarctic O3 column (DU) time-series for September-means (2000)
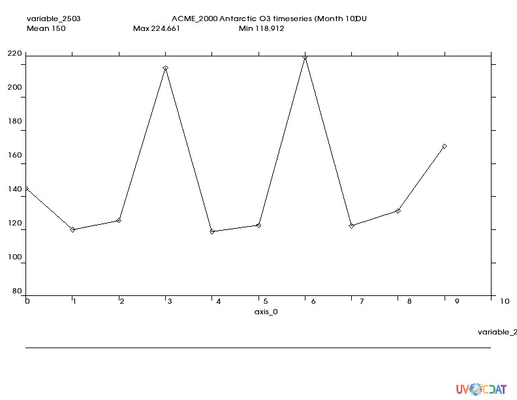
NOTE: the x-axis is simulation year, and the y-axis is the ozone column (DU).
ACCMIP Antarctic O3 column (DU) time-series for September-means (2000)
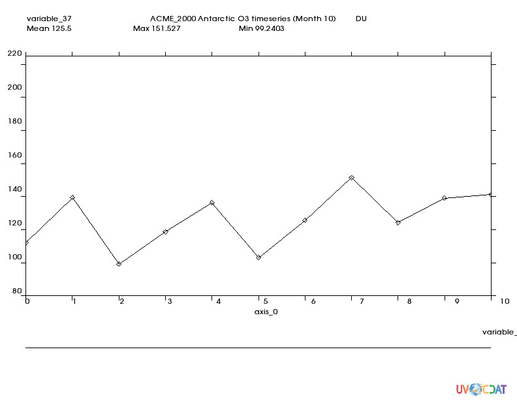
ACME Antarctic O3 column (DU) time-series for September-means (1850)
NOTE: The verticle scale is different for the 1850 plots. This is broadly consistent with the observed trend, although we don't have much data prior to the CFC era.
ACCMIP Antarctic O3 column (DU) time-series for September-means (1850)